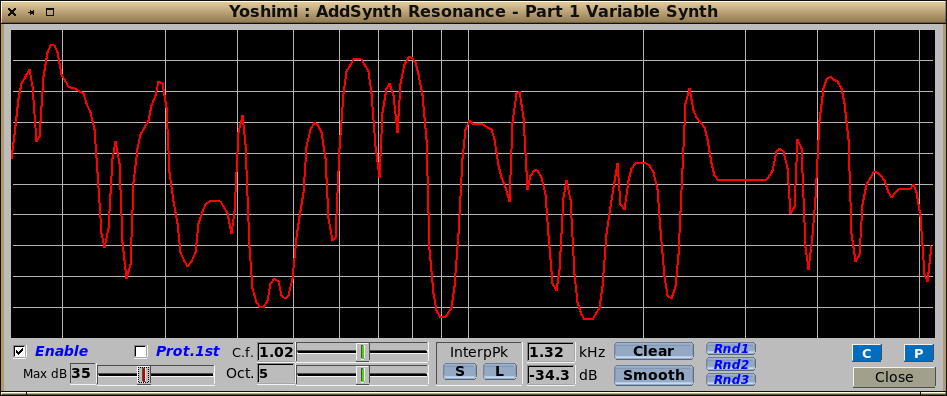
Yoshimi emulates resonance by varying the amplitude over a given frequency range with a graph of 256 evenly spaced reference points, irrespective of the note played. The horizontal centreline represents 0dB, so values above this are amplification, and those below are attenuation.
Once enabled, there are two ways you can set up a resonance graph. You can either 'draw' it with the mouse pointer, or you can use one of the random buttons, then maybe redraw parts that you're not happy with.
If drawing, you will see the frequency and amplitude of the point where the mouse is in the kHz and dB displays below the graph (slightly right of centre). You will almost certainly want to use one of the interpolations to get a smooth graph.
Enable Activates the resonance feature and its graph.
Prot. 1st (protect first) Ensures that the amplitude of the fundamental of a note doesn't get changed by the graph.
Max dB Sets the range of amplification/attenuation.
C.f. The center frequency of the resonance graph.
Oct. The number of octaves covered.
InterpPk S Interpolate peak levels for a smooth overall graph.
InterpPk L Interpolate peak levels for a linear slope between peaks.
kHz Indicates the frequency component of the mouse position in the graph. The scale of this control is set by the octave setting.
dB Indicates the amplitude component of the mouse position in the graph. The scale of this control is set by the Max. dB setting.
Clear Set the graph to a flat line, so no resonance.
Smooth This is not like smooth interpolation but can be used to progressively even out and reduce the amplitude of the graph.
Rnd1 Sets a coarse randomised graph.
Rnd2 Sets a more detailed randomised graph.
Rnd3 Sets a highly detailed randomised graph.
If Resonance was called from PadSynth there will be an additional Apply button just above the Close one, as the wavetable has to be rebuilt.